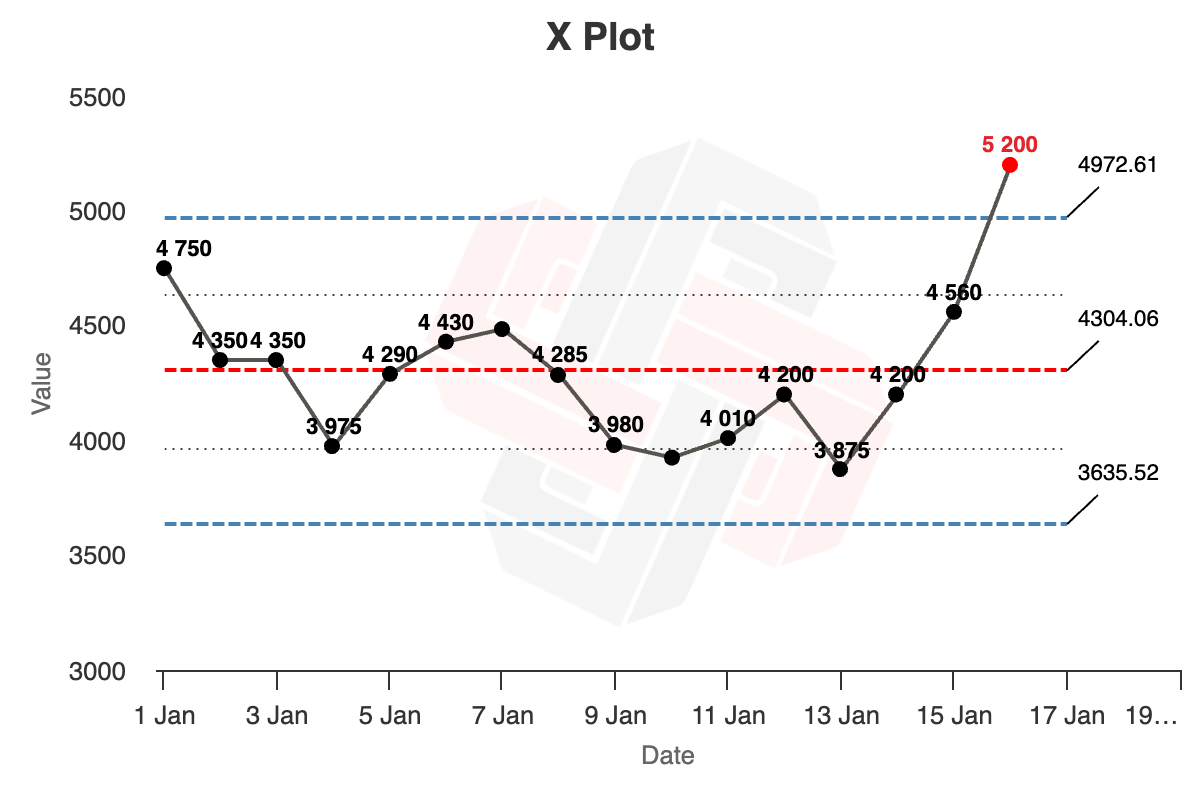
Xmrit (pronounced ‘xam-mer-it’) is a free tool by Commoncog to help business operators quickly create and share XmR charts.
An XmR chart helps you analyse your data. In a sentence: it helps you separate signal from noise. It is particularly useful to business operators.
…
XmR charts are so named because they consist of an ‘X’ chart (the ‘X’ variable, or the metric you care about), and a ‘Moving Range’ chart, which shows differences from point to point.
Rule 1: Process Limit Rule
Rule one states that if a point lies outside the limit lines (the blue lines), on either the X chart or the MR chart, something unusual is going on.
Rule 2: Quartile Limit Rule
Rule two states that if you have a run of three out of four successive points that is closer to the limit lines (blue dotted lines) than the centre line (red dotted line), then this is a moderate source of exceptional variation and you should investigate.
Rule 3: Runs of Eight
Rule three states that if you have data points in a row on one side of the average (red) line, this is a weak source of special variation and you should investigate.